


Hold my beer
Misdefining insurance problems as climate change narrative using rhetorical party tricks


Monday morning, in the
Journal, I gave a history of the conflation of climate change advocacy with insurance market volatility. The problems we face with insurance costs are a long time in the making as a product of our prosperity and development practices. They have little, if anything to do with climate change.
On the same Monday morning, the New York Times and the Wall Street Journal ran pieces covering the release of new marketing material by the modeling firm, First Street, arguing a collapse of real estate values born of a climate change fueled insurance crisis. Actually, the NYTimes has been pushing this narrative hard through a series of pieces since about mid-December.
First Street is a risk modeling firm originating as an NGO in 2017. The firm became influential quickly and its risk products were used across many agencies under the Biden Administration.
Last year, First Street restructured as a private company with investors including, Galvanize Climate Solutions, the venture capital firm of climate advocate and business leader, Tom Steyer. A bit over ten years ago, Steyer had pioneered the research collaboration, Risky Business Project, and, according to one close to it all, “First Street uses a lot of the same underlying climate data that we used at Risky Business, or actually created there.”
Today, the First Street website states that it “exist[s] to make the connection between climate change and financial risk at scale for financial institutions, companies and governments.” Their risk products are embedded in prominent real estate platforms RedFin and Zillow.
In my essay for BTI, I noted that much climate advocacy has subtly shifted to the marketing of risk analytics for financial activities.
In my brief read of the recent First Street marketing report that made headlines, a few passages caught my attention.
Here are three examples of subtle shifts in word choice and explanation that I’ve come to think of as rhetorical party tricks whereby observed trends in losses and public struggles with insurance pricing are misframed to fit the advocacy oriented climate change narratives.
Example #1
Even more striking is the rise from 2017 alone, which accounted for a 66% increase in insurance costs relative to mortgage payments and marked 2017 as the costliest billion-dollar disaster year in the U.S. on record (NOAA, 2024). Thus, this sharp escalation reflects both the growing frequency and severity of extreme weather events as well as insurers’ evolving assessment of longterm climate risks in their pricing.
It is important to know about trends in US hurricane landfalls and the large role they have in global loss experience to understand why this statement is misleading.
In between, Hurricane Wilma in 2005 and Hurricane Harvey in 2017, the US experienced no major category landfalls. That’s a major streak of luck which we could all be grateful for. However, in 2017 the US experienced Hurricane Harvey, Hurricane Irma, and Hurricane Maria (landfall in Puerto Rico).
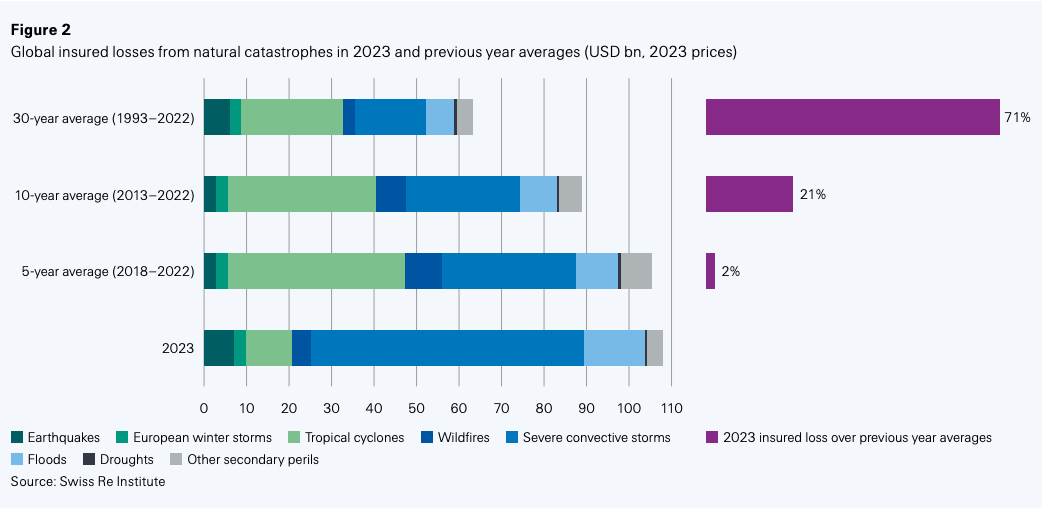
It is also a big deal because hurricane landfalls- specifically US hurricane landfalls- account for a substantial portion of the insured losses from storms. The image below from Swiss Re shows the significance of hurricane landfalls for loss experience.
Because of the lack of landfalls (and so, losses) between Wilma and Harvey, there was a tremendous amount of money floating around in the industry stirring competition and putting downward pressure on insurance prices.
You can see the effect of the market competition in the data of policies in force by Florida’s public insurance provider, Citizens Property Insurance Corporation. Prices spike post 2005 and Citizen’s policies increases; as prices come down on the private market Citizen’s policy count decrease.
This is an insightful read on the re/insurance business cycle.1

The losses from hurricanes since 2017 stacked up and, along with losses from growing exposure to severe convective storm and wildfire, finally ran a afoul of sudden changes in background market dynamics: low interest rates enjoyed since 2008 increase around 2017, COVID-19 took center stage in 2020, and inflation spiked. So, Citizen’s policies increased as private market pricing went up.
That is to say, the “sharp escalation” in events is really the end of what had been known as a drought in hurricane landfalls coupled with challenging market conditions.
There is, however, a general increase frequency of loss events according to Swiss Re in their recount of 2023,
There were 142 insured-loss inducing catastrophes in 2023, a new record. Most were of medium severity, which we define as events resulting in losses of USD 1–5 billion. The number of such events has on average grown by 7.5% each year since 1994
Swiss Re attributes this event frequency to a “rising number of urban areas targets.” This is the equivalent to what researchers have termed the “expanding bull’s- eye effect.”
Interestingly, 7.5% is also the annual nominal exposure growth given by Verisk.
Example #2
However, as natural disasters become more frequent and result in increased property damage claims, insurance companies must adjust their pricing strategies to maintain profitability. This dynamic has positioned the insurance industry as one of the first and most visible indicators of climate risk in the housing sector.
Notice that the first sentence references frequency in disasters and increased claims, which is a product of the built environment. So, see above discussion.
The second sentence extends the misguided reasoning of the first sentence to claim to create the wrong conclusion that insurance pricing is a harbinger of climate risk (an ill defined term that is usually used in reference climate change.)
However, because economic losses are overwhelmingly a product of socio economic factors, losses are not a useful place to sort out changes in weather and climate. By extension, because insurance pricing responds to many background factors such as technological change, costs of capital, and losses- insurance pricing is a terrible place to look for a signal of climate change.
Example #3
Since 2019, homeowners insurance premiums have risen 31%, with average yearly increases of 6.1%. This increase reflects both rising rebuild costs, as insurers respond to higher construction material and labor expenses, as well as insurers’ growing operational costs, leading them to adjust coverage limits accordingly. While inflation has contributed to these cost pressures, insurance premiums have grown faster than general inflation, which rose 22% from 2019 to 2024, averaging 4.4% yearly (FRED, 2024). These differences point to additional cost drivers beyond inflation, primarily the surge in climate-related damage claims from increasing extreme weather events nationwide. Therefore, climate risk has become a key driver of insurance premiums.
According to the above, premiums have increased 6.1% annually for a host of reasons, inflation being an important one. Inflation has increased 4.4% annually. So, really, there is a 1.7% annual increase in premiums that is unaccounted for. This is hardly a “surge” in climate change as a “key driver” of premiums.
Verisk said climate change accounts for 1% annual increase in losses.
Swiss Re said climate change accounts for a high estimate of 1% for annual increase in losses from severe convective storm. The value appears to be derived from their FT 10, a single study that concludes there is much uncertainty. Swiss Re also gives another 1.3% to a general realm of uncertainty and variability.
Meanwhile, there is steady stream of anecdotal evidence that investor expectations and risk perceptions are a factor in insurance pricing. I don’t know if that amounts to some level of percentage on premiums but it seems reasonable to expect that it does.
In this context, 1.7% would seem to fit somewhere along the spectrum of: We Have No Idea and Let’s Hedge in Favor of Investors.
The persistent and increasingly loud misframing of insurance problems as climate change is deeply problematic for dealing with underlying causes of either issue.
The underlying cause of exposure growth in loss trends that can be dealt with to some degree through improved land management and business codes.
I am also with the impression that there is a growing challenge at the intersection of family budgets which are steady and exposure to capital markets which are dynamic.2
Give me back my beer.
At the link is this statement: “There is still a distinction between the primary sector and the reinsurance one, he said, and at the moment, that’s a situation which is here to stay – albeit with some room for realignment.” I think this will be an important space to watch for context in public debates about the primary market.
I would love to have feedback on this point.
Inflation in insured loss can’t be compared to general rates of inflation. In addition to the reasons you cite costs post-event are significantly affected by localized demand surge (cost of plywood, etc.), labor and material availability. There is also a significant influence in the post 2017 period arising from the increased involvement of public adjusters by claimants and litigation. This leads to larger claims ( i.e, replacing entire roofs rather than the damaged portion, etc.) and also some fraud. Some states have attempted to control this “social inflation”, but the increase in loss adjustment expense is a meaningful driver of overall loss cost inflation.
According to the Shiller Home Price Index, home prices have increased about 50% since 2019 (~210 -> ~320; 110/210 ~ 52%). Some of the increase is from increased land value, but most of it should be from the actual building/structure.
https://fred.stlouisfed.org/series/CSUSHPISA
Looking at the CPI estimate of home insurance increases, the increase is < 10% (much less than the 31% figure in example 3).
https://fred.stlouisfed.org/series/CUUR0000SEHD
CPI also estimates home price inflation to be less than Shiller (~25% vs. Shiller's 50%):
https://fred.stlouisfed.org/series/CPIHOSNS
It would seem First Street's conclusions are predetermined, and the underlying statistics are rather dubious.